Onward and upward
Today's GSAP case-study will be into another animation I did for DigitalOcean. The goal was to illustrate the growth of the company since its infancy.
Let's take a look at the illustration I was given:
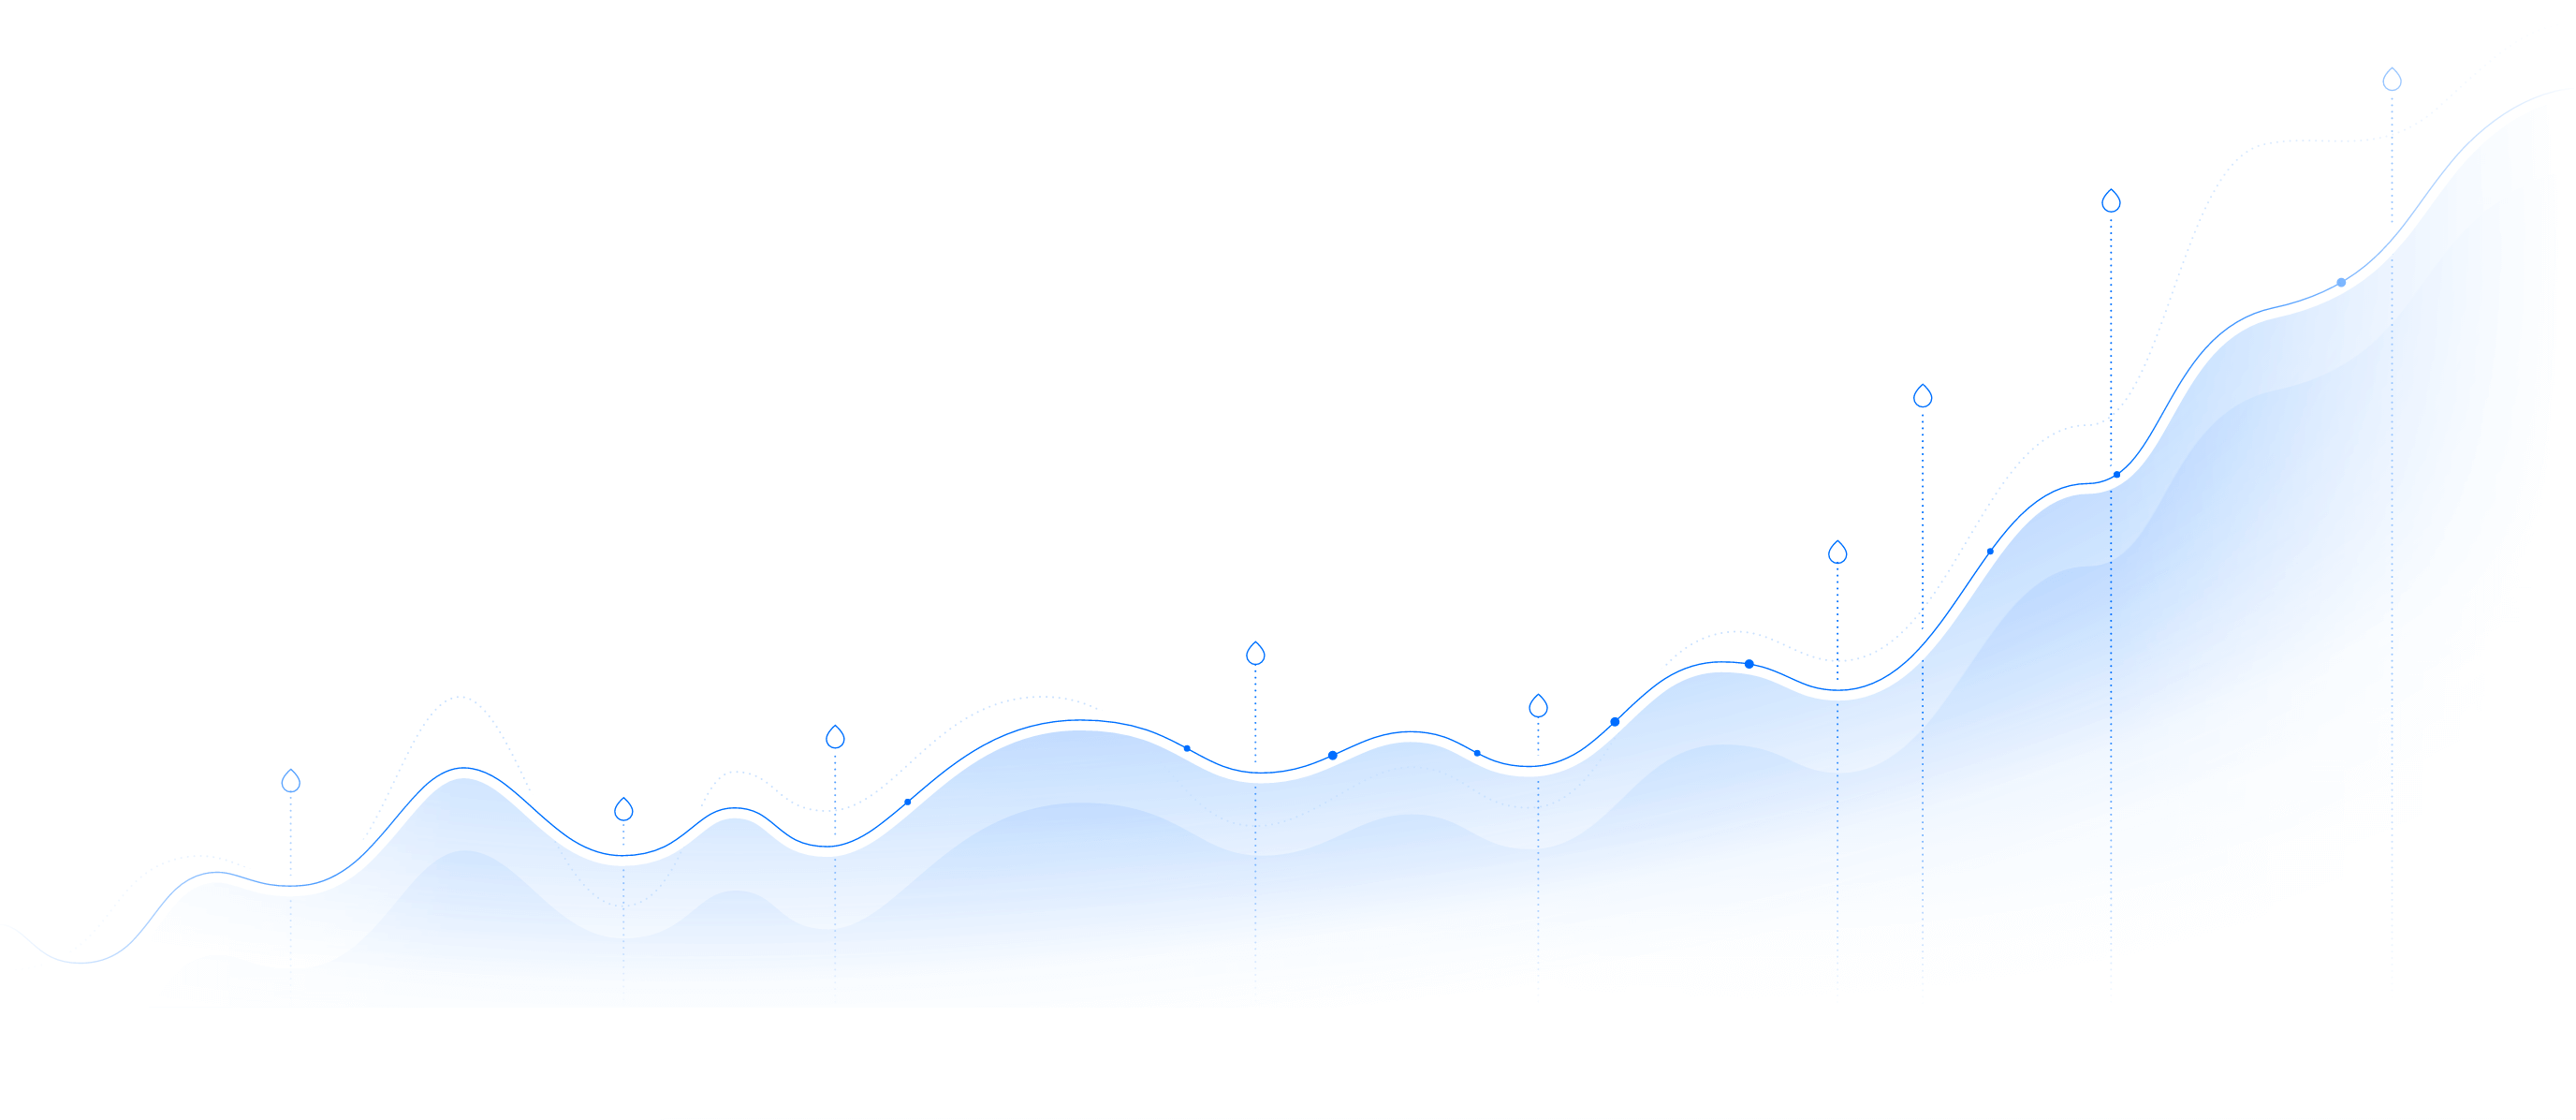
Breaking this down, there were a few different pieces to this animation:
- A main graph stroke that we want to draw starting from the left.
- Dotted-lines with Droplets that will stagger in and have the Droplets pop-in when each completes.
- Smaller dots that will follow the upper-portion of the graph, fade away, and start over again.
Task 1
Thinking back a few years ago, drawing in a path is something that would seem like pure magic—in a lot of ways it still does. Nowadays, it's just another tool at our disposal. Chris Coyier wrote an article explaining the ins-and-outs of this phenomenon, including a great example to get you started. With the power of GSAP, we can actually make that part of intricate timelines easily with their DrawSVG plugin.
Task 2
We have several "background Droplets" with dotted lines that we'd like to stagger in to represent milestones along the way for the company. My first-pass at this was to draw these dotted lines on the graph just as the main stroke was. Unfortunately, due to how DrawSVG is calculated, that's easier said than done. While there are some workarounds, our use-case was a little more involved since there wasn't a solid background. So, identifying that these milestone-markers were straight lines, I instead went the route of animating their y position instead; same effect - MUCH easier.
For the Droplets located at "the end of the road" for each milestone, I used a combination of GSAP labels and delays to get the timing just right.
Task 3
Similar to my last case study, I started this with a typical "deer in headlights" look on how to best approach this.
First-off, did you know that this will be possible in the future?! Pretty cool stuff. Now, back to the reality of old browsers and pop-up ads. Unlike my other case study, this was a perfect candidate for the Bezier plugin to shine. With the power of MorphSVG and its pathDataToBezier() function, I was able to feed it the coordinates of the main graph stroke path. Then, by determining the speed and length of time it would take for each dot to reach the end, adjusting both the delay and opacity fit perfectly. Since there were multiple dots that we'd be moving at the same time, creating a mini-timeline for each required a loop.
Having this run on "init" of the animation took only wrapping the above in a function and having it called on the timeline's onStart() callback.
Below is the finished product. Let me know what you think!