Responsive data visualization
When plotting data on the web, there's lots to consider for a consistent experience:
- What type of graph is appropriate to differentiate the data?
- Will my axis labels scale down on smaller screens?
- Is the graphing library configurable enough to support customizations; while not introducing a technical-layer that is hard to scale in the future?
For a recent project; I was tasked with replicating large sets of data, amongst numerous types of graphs - that needed to check-off each of the boxes above.
Choosing a graph library
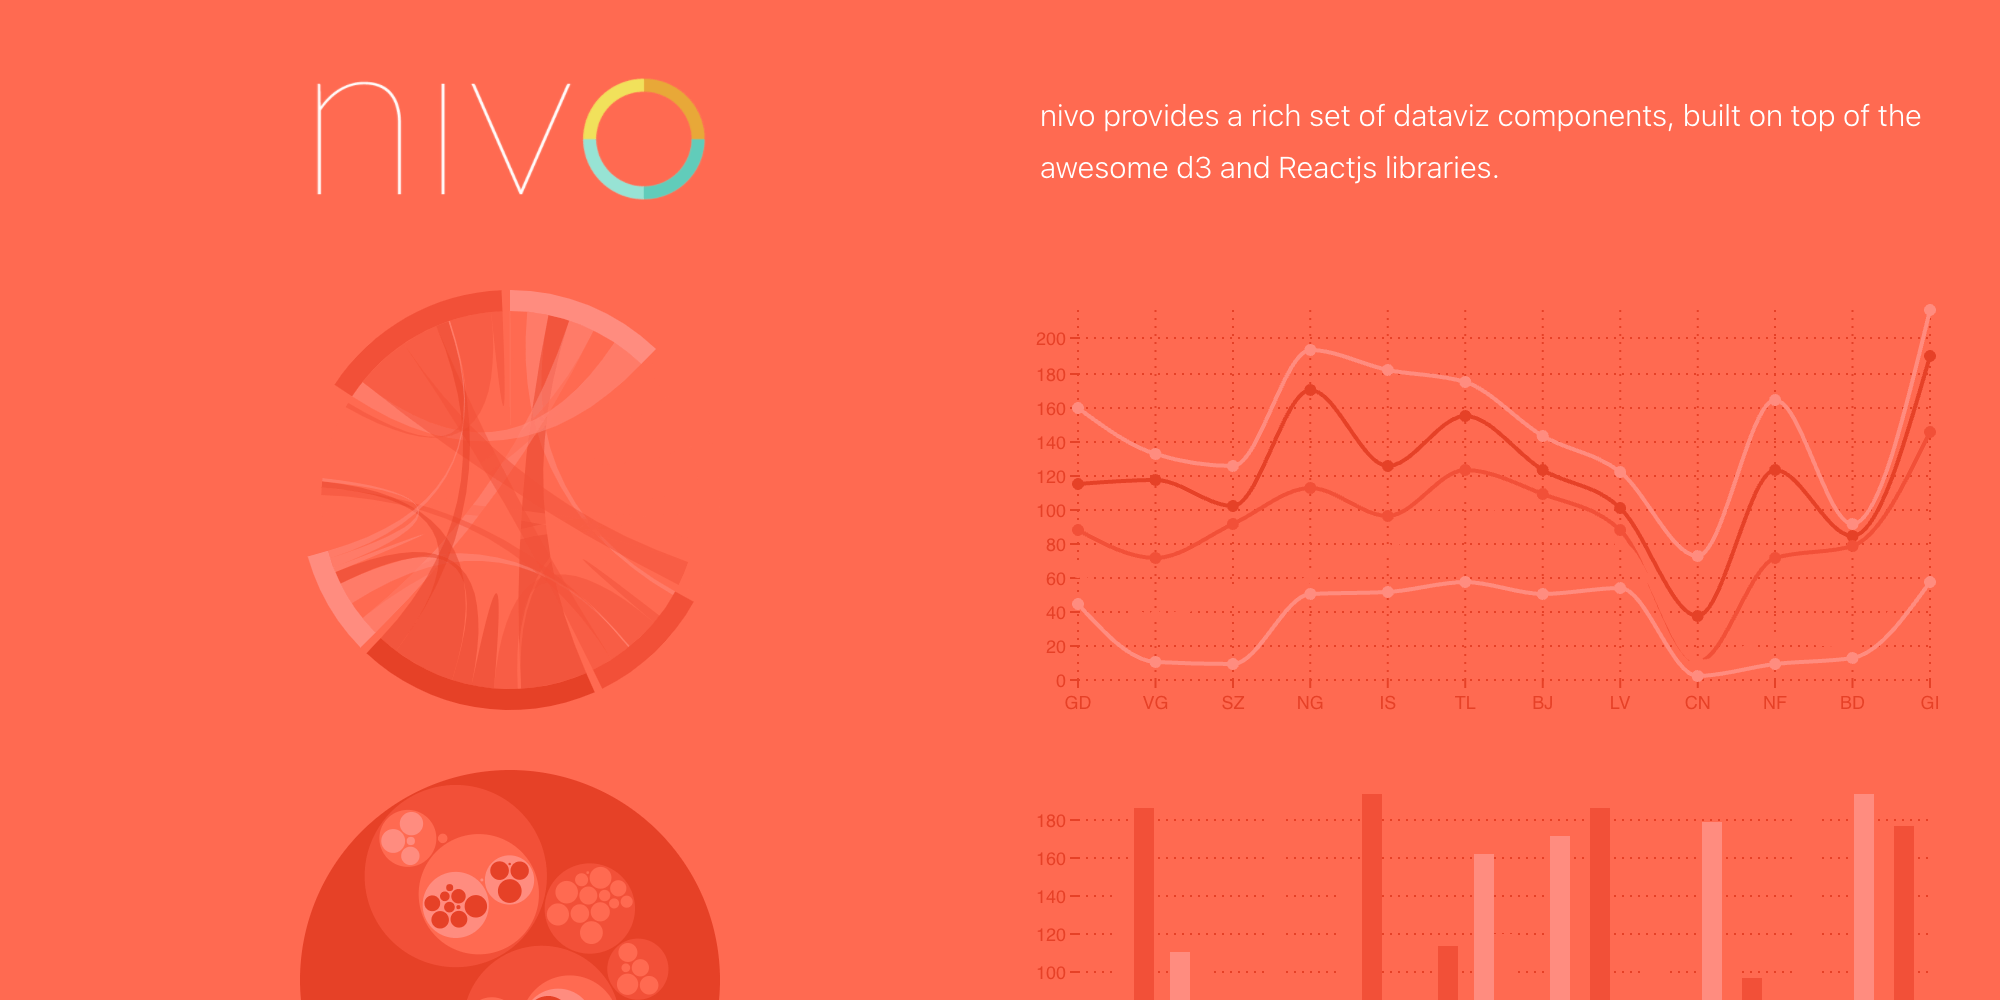
The open-source community never seizes to amaze me. Spurring from a suggestion by @kyehohenberger, Nivo came away as the perfect-pairing to meet both the design and technical needs of the project.
Built on-top of D3, Nivo provides a wealth of pre-configured graph-types - with a highly extensible API-layer that allowed me to move fast and make changes along the way.
Placing axis labels
With libraries like @visx/text alongside Nivo's labels property, we're able to fit SVG <text /> elements into tight-spots; with auto-wrapping.
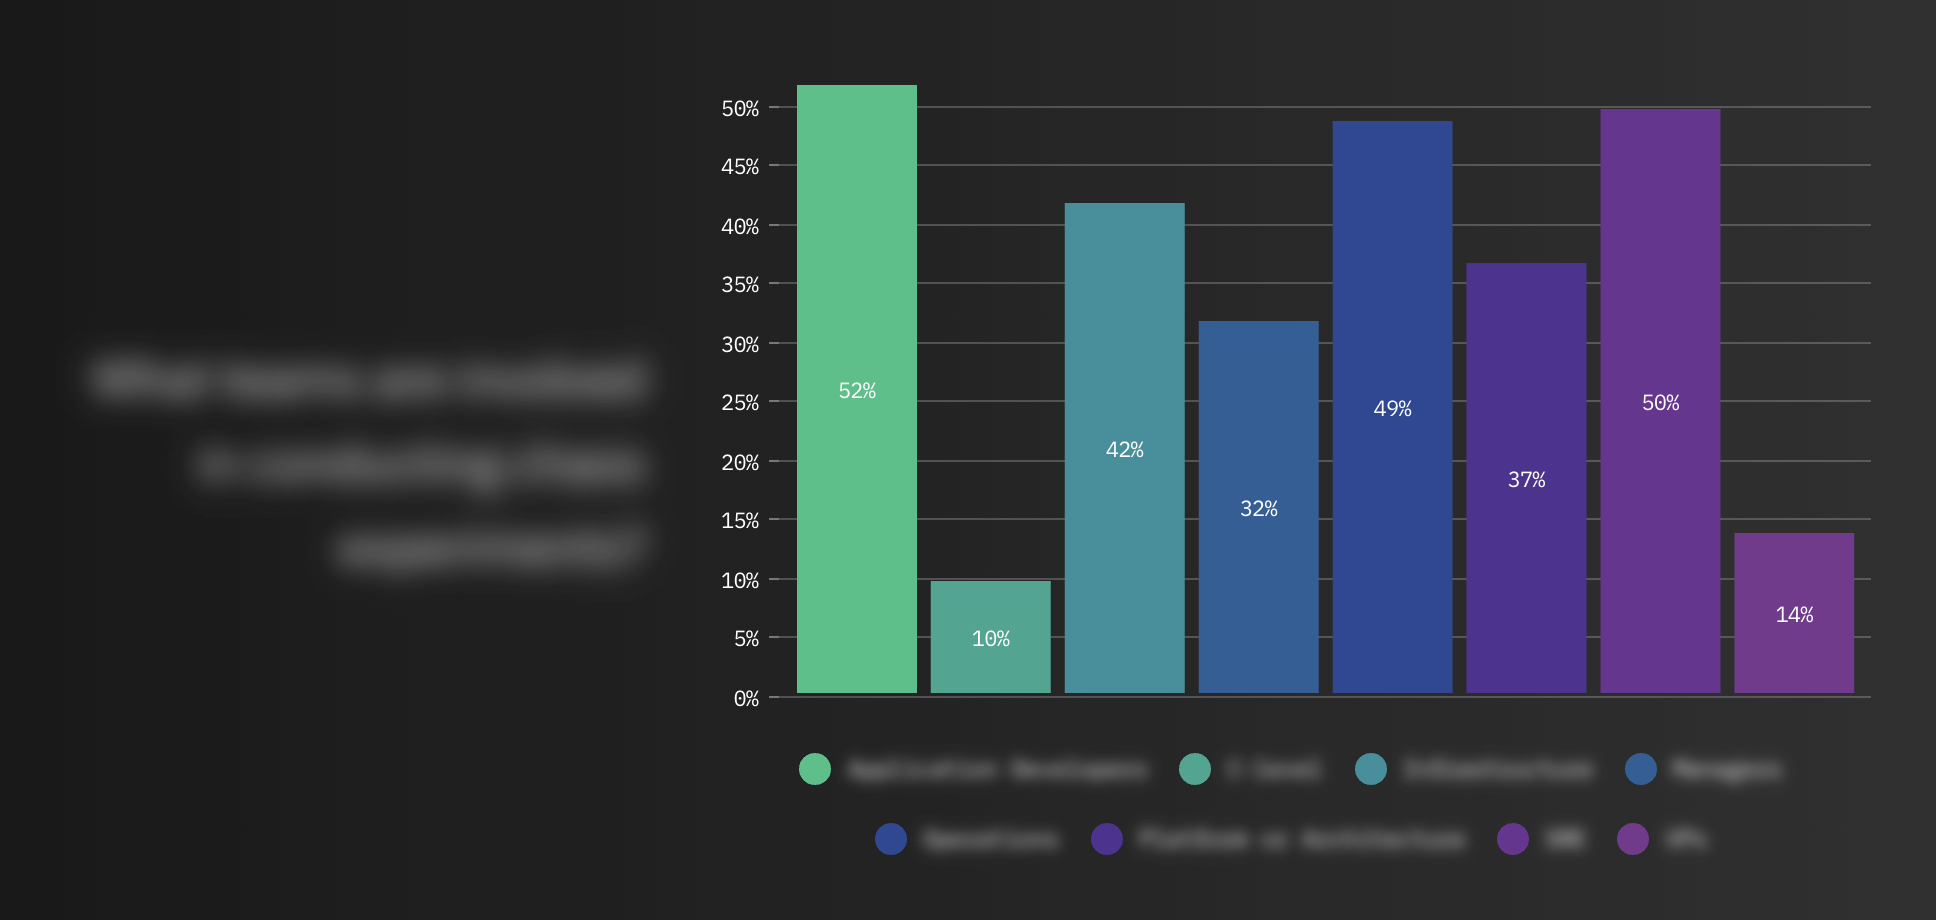
Where this method starts to falls-apart, is when we view large sets of data along an axis on small screens. We're faced with two ill-fated scenarios - text which is too small to read OR text that overlaps each other.
For this project; I decided to create a custom legend outside of the graph; which I could control with normal HTML/CSS for a more dependable experience on all screen-sizes. Because I defined a dedicated pallette via Nivo's colors property, I passed-through my dataset and looped over it; matching to each color instance perfectly.
Updating graph properties based on screen size
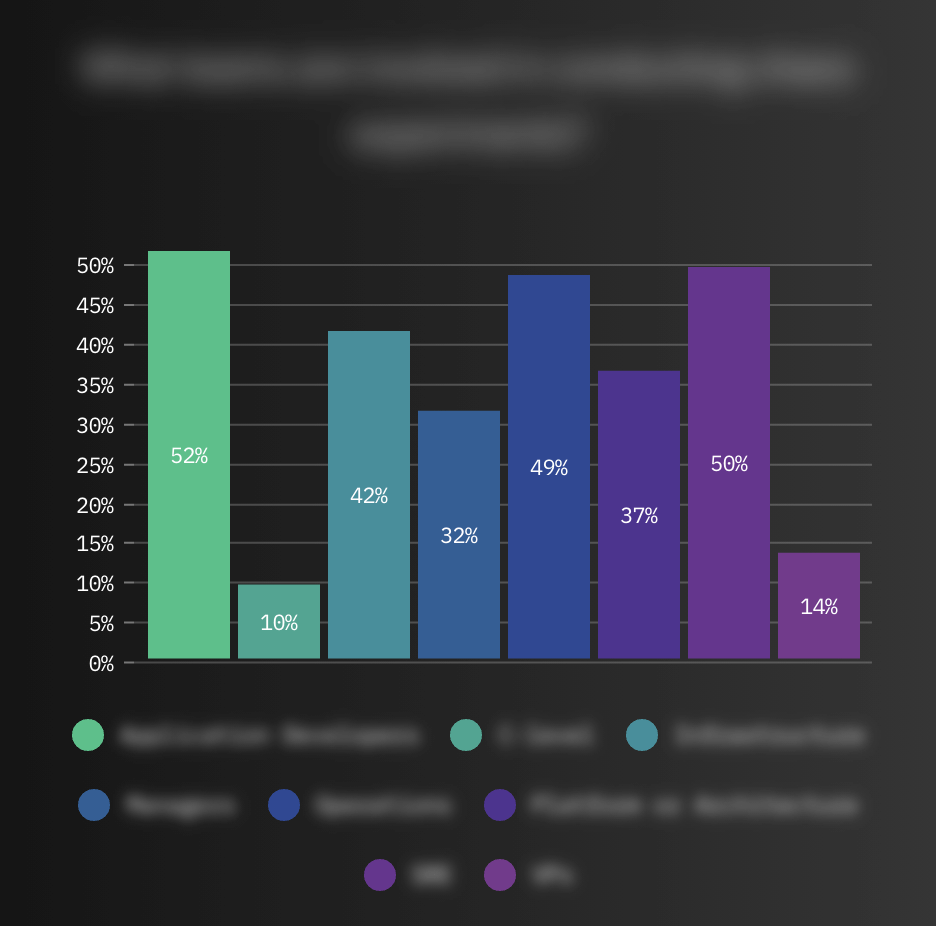
While Nivo provides scalable variants for many of their graphs; such as <ResponsivePie /> and <ResponsiveBar />, altering their configuration based on screen-size is not something that is available out-of-the-box.
Luckily, we can use a matchMedia hook to re-render the graph with updated properties whenever we'd like:
By using matchMedia instead of a generic resize listener; we can update our view based on a singular, performant event.
Nivo has quickly become my go-to for data visualization and am looking forward to using it on my next project.